
NBA Over-under Betting
Empower sport bettor to make data-informed decision and engage with the NBA.
Role
Data Science Student
Timeline
3 Weeks
Team
Jimmy Wang, Ethan Chen
Methods
Data Mining, Data Cleaning, Feature Selection, Feature Engineering, Machine Learning
00 Overview
In NBA over-under player betting, bettors predict whether an individual player will exceed or fall short of a specific statistical benchmark, in this case, points scored, established by the bettors. This form of betting offers a focused view of individual player performance, providing fans with a more granular and engaging way to interact with the NBA.
**How does it work? **
Before the game, bettors set the over-under line for each player, considering factors such as their past performance, matchup dynamics, and team strategies.
Bettors then place wagers on whether they believe the player will surpass (over) or fail to reach (under) the designated benchmark.
If the player's performance exceeds the set benchmark, bets on the "over" win; if it falls short, bets on the "under" win.

How many points is Anthony Davis going to score in his game today? If bet > 26.5, betting $145 wins you $100 (total: $245). If bet > 26.5, betting $100 wins you $115 (total: $215).
Over-under Sports Betting
01 Problem Scope
Sports betting platforms endeavor to elevate fan engagement by incorporating over-under betting options, utilizing technology and data analytics for immersive experiences. We have identified key stakeholders and assessed the potential effects of our data models on their engagement and interaction with the platform.
How might sports betting platform increase engagement on betting websites?
How might NBA enhance fan engagement with NBA games and associated products?
How might we benefit sport bettors by providing them better informed decisions?
But…first, the data problem:
What individual player’s statistics contribute to enhancing the accuracy of predicting an NBA player's points on a game-to-game basis?
02 Dataset
NBA 2021-22 Season Statistics
The dataset is extracted from NBAstuffer.com, a website that provides NBA content and statistics for basketball research.
▲ The Raw NBA 2021-22 Season Statistics Dataset

Records (Rows)
Each row represents the record of an individual player's performance in a specific game they played during the NBA 2021-2022 season.
Features (Columns)
There are 26 features comprising both team matchup data and individual player data during the NBA 2021-2022 season.

03 Feature Selection
We chose the features based on their correlation, p-values, and our expertise in the domain.
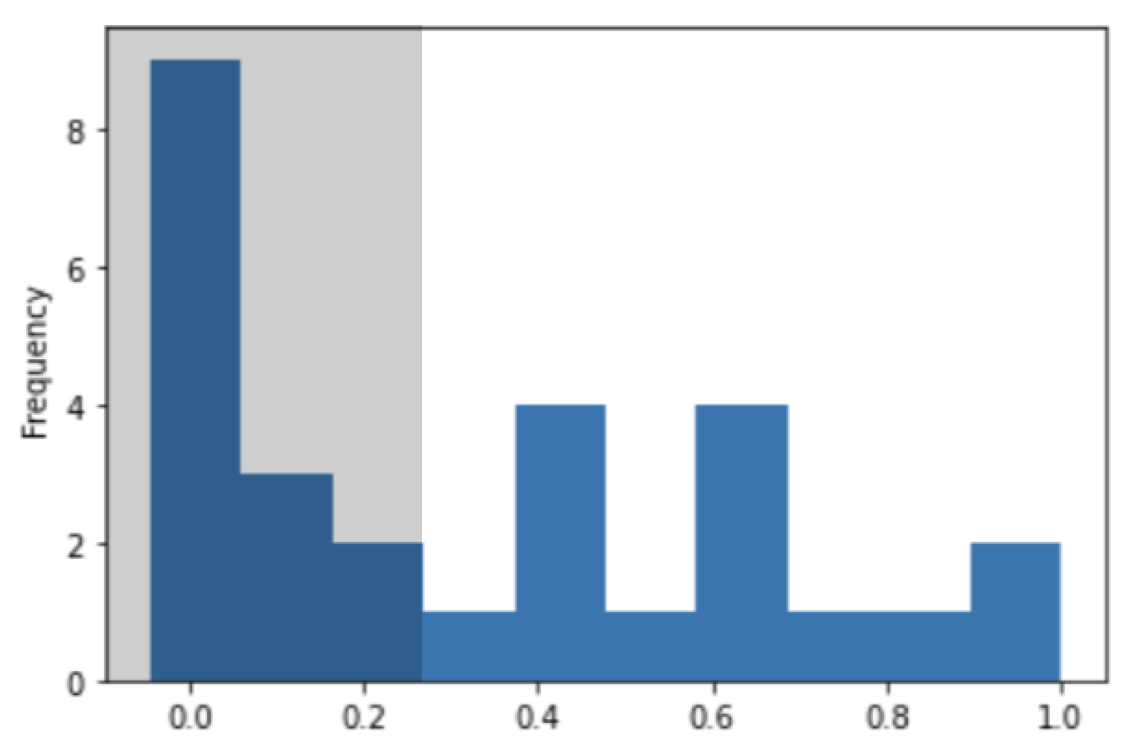
▲ Histogram of the Correlations
Here are the features selected:
Minutes played (MIN)
Three point goals made/attempted (3P/3PA)
Total rebounds (TOT)
Assists (A)
Turnovers (TO)
Usage rate (USG)
01 CORRELATION MATRIX
We selected features with a correlation coefficient ≥ 0.3, concerning points scored. Threshold was determined through experimentation.
Why 0.3?
Choosing a correlation threshold of 0.3 in NBA statistics allows for the retention of valuable information while avoiding the oversight of non-linear relationships. According to the graph on the right, this threshold strikes a balance between capturing enough insights and maintaining data integrity. Ultimately, this approach promotes model flexibility, reduces bias, and enables a more accurate understanding of player performance.
However, there are two special cases to note.
Usage Rate: We refrain from using metrics integral to usage rate, including field goals, free throws, and turnovers. Introducing them as separate features could potentially lead to multicollinearity issues.
Three point goals made/attempted (3P/3PA): With that said, while three-point shots and field goals are highly correlated, we acknowledge the added significance of the three-point statistic.
▲ Correlation Matrix of the Features
02 P-Value
We evaluated significant features with a p-value ≤0.05. All of the statistics present in the correlation matrix surpassed this threshold.
Here are the features selected:
Minutes played (MIN)
Three point goals made/attempted (3P/3PA)
Total rebounds (TOT)
Assists (A)
Turnovers (TO)
Usage rate (USG)
**All the highlighted features have a p-value less than 0.05. However, the yellow highlights are the once that passed the correlation threshold of 0.3 and the p-value test.

03 Domain Knoweldge
We excluded records of players who participated in fewer than 7 games, which equates to less than 2 weeks, during the NBA 2021-22 Season due to insufficient data for the model.
We cleaned the dataset based on our domain knowledge of NBA games and selected specific features that align logically with predicting point totals.
Games played
Rationale
Reduce noise in analytics
Improve data quality
Focus on regular contributors for meaningful analysis
We excluded records of players' first game of the 2021-22 NBA season. Prior game data is necessary to predict the point total for a player in the current game.
First game of the season
Rationale
Absence of prior game data
Reduce outlier performances due to offseason adjustments, roster changes, or simply getting into the rhythm, etc.
Follow the best practices in NBA performance analytics

▲ Garbage time starts around half pass the 4th quarter (~8 minutes before the game ends)

▲ Differences in usage rate between home and away games
“Garbage time”. We removed records of players who played less than 6 minutes in a game, as such players typically participate during the concluding moments with already determined outcomes.
Minutes played in each game
Rationale
Reduce noise in analytics
Minimize unfair evaluation of performance
Venue (Home/Away)
We conducted one-hot encoding to indicate whether the player is competing in their home arena or not. According to the usage rate, a consistent difference exists between home and away games, regardless of whether the player is a starter or non-starter.
Rationale
Consider performance discrepancies due to experience, familiarity, fatigue, etc.

▲ Correlation between starter status and points scored, as well as minutes played
Consider performance discrepancies due to skills, experience, strategic fit, etc.

Starter
We performed one-hot encoding to indicate whether the current player is a starter. As shown in the graph, starters generally play more minutes and score more points than non-starters.
Rationale
04 Feature Engineering
3-Game Moving Average
We employed the moving average technique, which computes features representing the average points scored and average minutes played by the individual player in their last three games. We decided to go for 3-game moving average over 5-game moving average, due to sensitivity to the most recent performance. (**If 3 games are not available (e.g. we are predicting the third game of the season), then the moving average is reduced to represent the number of available games )
05 Machine Learning Methods
Model Input & Output
We utilized the past 3-day moving average statistics of the player's top 5 teammates and top 5 opponents, along with the player's own metrics, to predict the player's actual points scored in that specific game. Our approach was inspired by understanding how bettors make decisions, emphasizing the significance of contextualizing individual performance within the broader game dynamics.
Incorporate contextual information
Conduct matchup analysis
Implement strategic player adjustments
Rationale
Multilinear regression captures linear relationships, complementing XGBoost's non-linear nature. Additionally, it helps prevent overfitting by penalizing complex interactions and reducing model variance.

▲ XGBoost as ensemble (combine multipled prediction) method often lead to higher accuracy
01 XGBoost
XGBoost is an open-source implementation of the gradient boosted trees algorithm. This supervised learning algorithm excels in both regression and classification tasks.
02 XGBoost + Multi-Linear Regression
06 Machine Learning Model Validation
Correlation between True PTS and Predicted PTS
XGBoost may encounter challenges with overfitting due to its high sensitivity to noise and variability. As a result, correlation values display notable variations, ranging from 0.2 to 1. With multi-linear regression, the model demonstrates significantly improved accuracy and consistency compared to the pure XGBoost model, with a correlation coefficient of approximately 0.84.
True PTS vs predicted PTS trends based on domain knowledge
XGBoost
The error range exhibits greater variability compared to the second model. XGBoost appears to prioritize precise point predictions rather than capturing the broader statistical trends or patterns.

▲ There are more errors above 10 in the soley XGboost model.
XGBoost + Multi-Linear Regression
The model excels in capturing the overall trend, but it may struggle with accurately predicting the precise points scored by players.This model proves effective in capturing linear relationships.

▲ With multi-linear regression, the variability of the errors decreases, proving the importance in incorporating linear considerations in the model.
07 Conclusion
Capture the general trend instead of predicting precise points
In strategies focused on estimating points above or below a specific threshold, prioritizing the ability to capture the general trend is more crucial than achieving precise point predictions.
Utilize comprehensive linear and nonlinear approach
A solely XGBoost model holds promise for generating more reliable outcomes. However, the second model underscores the significance of capturing linear relationships within NBA statistics.
08 Reflection
Establish the correct “data” problem
While both models are designed to forecast the scoring accuracy of individual players, it is essential to recognize the imperative of refining our “data problem” to better articulate the central challenge of capturing trends with greater precision. This acknowledgment underscores the need to delve deeper into the nuances of player performance, beyond mere accuracy, and to focus on elucidating the underlying patterns that drive scoring dynamics in the context of the game.
Trust my domain knowledge and data instinct
I learned that understanding basketball intricacies aids in formulating relevant hypotheses and designing appropriate models, while data instinct enables uncovering patterns and anomalies. By embracing curiosity, I can refine predictive models and adapt to the dynamic nature of basketball analytics, ultimately uncovering actionable insights..
If we had more time…
Personal Growth…
Interview NBA Experts
While we crafted the dataset with our amateur NBA knowledge, embracing the expertise of professionals during dataset engineering and model design can certainly enhance our models.
Integrate historical datasets
One major limitation of our models is the insufficient dataset for machine learning. Nonetheless, it is imperative to consider policy and rule changes in the NBA as well.
Explore more ML models
Although XGboost is great for its ensemble learning, other machine learning models such as neural networks or advanced clustering might lead to better results due to its flexibility and scalability. As a result, we acknowledge the advantages of testing additional machine learning models to refine our approach.